Investor sentiment reconsidered

This article is an on-site version of our Unhedged newsletter. Premium subscribers can sign up here to get the newsletter delivered every weekday. Standard subscribers can upgrade to Premium here, or explore all FT newsletters
Good morning. China has launched an antitrust investigation of Nvidia, in what “appears to be a political action rather than a legal one”. In response to this pointed escalation of trade tensions, the chipmaker’s shares fell all of 2.5 per cent (on a day the market was down). Once again, Unhedged is struck by the market’s confidence that the worst outcomes for global trade will be avoided. The market is often right. We sure hope it is in this case. Email me: [email protected].
Sentimental education
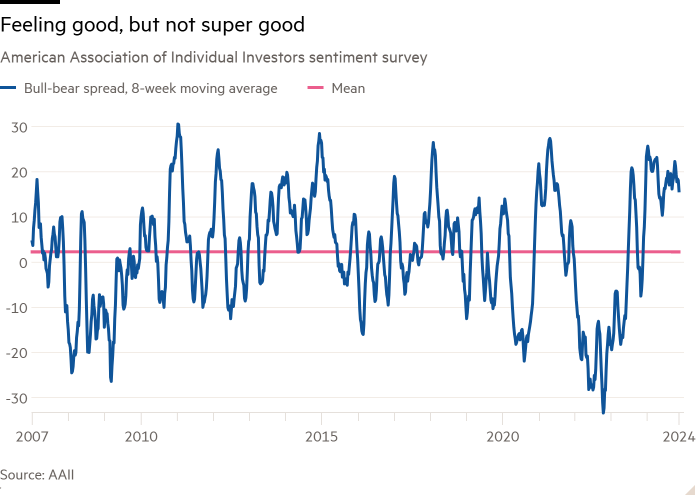
Last week I argued that while valuations of US stocks were about as extreme as they ever get, investor sentiment indicators did not display the uniform exuberance that characterises a bubble. As my primary example of the latter point, I used the American Association of Individual Investors sentiment survey. It is high but not at a peak, and has been moving sideways-to-down for more than a year:

Several readers suggested the AAII is not representative of the spectrum of sentiment indicators, many of which are more extreme, and that I ought to have another look. As is often the case, Unhedged readers have a point. The Conference Board’s consumer confidence survey asks whether respondents expect stocks to be higher in a year. Last month more than half said they will, which was by far the highest level in the 35-year history of the survey:

Both the Vix Index of stock market implied volatility and the Move index of Treasury market implied volatility indicate investors do not foresee trouble in the near term. While the Move index is above its pre-Covid lows, it has fallen below 100, to the lower end of the past three years’ range:

Here is the Goldman Sachs US cyclicals/defensives indicator, which shows the performance of a long cyclicals/short defensives stock basket. It is breaking out:

Bank of America reports that, in their wealth management and brokerage accounts, both levels of bond holdings and cash holdings are scraping along at the historical lows. These charts come from Michael Hartnett’s strategy team:

If loopy retail investor behaviour is your thing, here are retail flows into cryptocurrency funds, from Marco Iachini at Vanda Research. A cool billion rolled in last month:

I will admit that those last five graphs make a good case for extreme sentiment. Data points to add to the other side of the scale (along with the AAII) are not terribly easy to find. One moderately consoling fact is that margin debt in brokerage accounts, as tracked by Finra, remains below the 2021 highs (even if it is above trend):

Last week I noted the absolutely bonkers capital flows into US equity funds (documented by my colleague Nicholas Megaw here). At $140bn, November flows were by far the highest ever. But it is worth noting that, while the proportion of cash in individual investors’ accounts may be low, institutional investors are channelling capital into cash-like money market funds and more stable bonds. This chart shows the three-month rolling average for each:

Is it possible to be in an equity market bubble when near-record amounts of capital are flowing into cash? I’m not sure it is. One definition of a stock market crash is a bull market for cash. But we already seem to be in one of those.
More than that, though, I hesitate to say that sentiment is euphoric for completely subjective reasons. Things don’t feel crazy enough. No one, on hearing I write about markets, is asking me for stock tips (this sometimes happens, amazingly). When I talk to money managers and analysts, I always ask them about client sentiment. They have been saying that, far from feeling exuberant, investors feel slightly trapped in the US-dominated market. This is woefully unscientific, but bubbles are unscientific things. It is easy to imagine that, once uncertainty about Donald Trump’s economic policies is removed, sentiment rises to an unsustainable, loony high. But I don’t think we are there quite yet.
One good read
The lawyers always win.
FT Unhedged podcast

Can’t get enough of Unhedged? Listen to our new podcast, for a 15-minute dive into the latest markets news and financial headlines, twice a week. Catch up on past editions of the newsletter here.
Recommended newsletters for you
Due Diligence — Top stories from the world of corporate finance. Sign up here
Free Lunch — Your guide to the global economic policy debate. Sign up here
#Investor #sentiment #reconsidered


